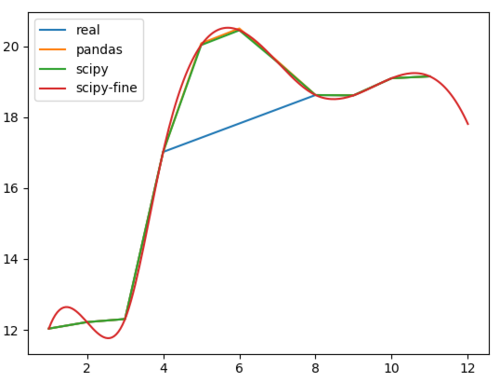
我正在做三次樣條插值,我得到的輸出對我來說似乎有點奇怪。輸入到 NaN 值中的值大于 NaN 之前的數字,并且大于 NaN 緊接之后的值。如果我使用的method=linear話是沒有問題的。但是,我更愿意使用method=cubicspline.下面是我希望插入的部分以及輸出的示例:df['a'] = df['a'].interpolate(method='cubicspline')插值之前 a1 12.0362 12.223 12.3064 17.0195 NaN6 NaN7 NaN8 18.6249 18.61510 19.09811 19.156插值后 a1 12.0362 12.223 12.3064 17.0195 20.08256 20.50137 19.58038 18.6249 18.61510 19.09811 19.156如果有人知道我是否做錯了什么,我將非常感激!謝謝
三次樣條插值用大于以下值的值填充 NaN
慕的地8271018
2023-10-26 15:17:37