我有以下二維數組:MyData = array([x = [ 82, 210, 203, 234, 135, 92, 176, 146, 246, 35, 257, 227, 258, 132, 31, 160, 269, 24, 248, 274, 281, 279, 71, 21, 188, 163, 243], y = [ 15, 16, 18, 18, 19, 21, 23, 29, 35, 47, 50, 53, 60, 64, 67, 69, 77, 88, 89, 91, 105, 115, 138, 175, 178, 205, 207]], dtype=int64)我想刪除彼此之間處于特定歐幾里德距離的所有 x 和 y 對。例如,此處 (210,16) 和 (203,18) 的距離小于 10,均應刪除。然而,在這樣做之前,我首先需要所有距離(這很容易),然后我必須刪除它們。所以,我創建了這個距離矩陣:distance = np.zeros((27,27))for i in range (0 , 27): for j in range (0 , 27): dist= np.linalg.norm(MyData[:,i] - MyData[:,j]) distance[i,j] = dist然后使用以下條件,我找到了我的索引:indx = (np.where((distance > 0) & (distance <= 10)))[0]indy = (np.where((distance > 0) & (distance <= 10)))[1]現在,我不確定如何使用從 indx 和 indy 獲得的索引來過濾“MyData”。
1 回答
Helenr
TA貢獻1780條經驗 獲得超4個贊
numpy的解決方案
首先準備數據
import numpy as np
x = np.array([[ 82, 210, 203, 234, 135, 92, 176, 146, 246, 35, 257, 227, 258,
132, 31, 160, 269, 24, 248, 274, 281, 279, 71, 21, 188, 163,
243],
[ 15, 16, 18, 18, 19, 21, 23, 29, 35, 47, 50, 53, 60,
64, 67, 69, 77, 88, 89, 91, 105, 115, 138, 175, 178, 205,
207]]).T
計算所有點對的距離
a,b = np.tril_indices(27, -1)
diss = np.linalg.norm(x[b] - x[a], axis=1)
找到距離小于閾值的點
distance = 10
near = x[np.unique(np.concatenate([b[diss < distance], a[diss < distance]]))]
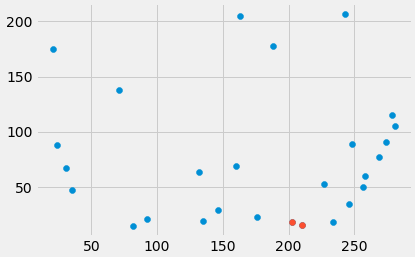
然后我們可以繪制點
import matplotlib.pyplot as plt
plt.scatter(x[:,0], x[:,1])
plt.scatter(near[:,0], near[:,1]);
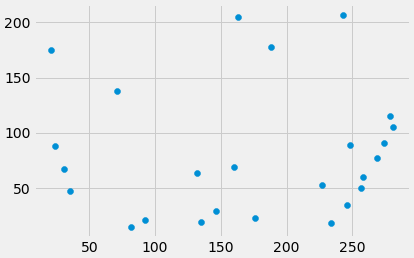
刪除點
remove = np.delete(x,np.unique(np.concatenate([b[diss < distance], a[diss < distance]])), axis=0)
plt.scatter(remove[:,0], remove[:,1]);
添加回答
舉報
0/150
提交
取消