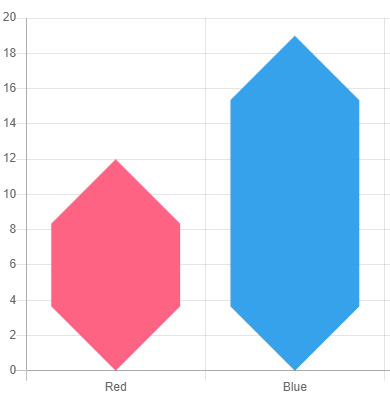
1 回答

TA貢獻1777條經驗 獲得超3個贊
獲取三角形的一種方法是制作堆積圖,并在頂部添加折線圖。為了保持其反應性,您需要動態調整線條數據上的 pointRadius 的大小。
https://jsfiddle.net/0mcd5s13/3/
或者在 Chart.js 的第 4640 行,您可以將 element_rectangle 繪制函數更改為:
draw: function() {
var ctx = this._chart.ctx;
var vm = this._view;
var rects = boundingRects(vm);
var outer = rects.outer;
var inner = rects.inner;
//ctx.fillStyle = vm.backgroundColor;
//ctx.fillRect(outer.x, outer.y, outer.w, outer.h);
if (outer.w === inner.w && outer.h === inner.h) {
return;
}
let offset = outer.w / 2;
ctx.save();
ctx.beginPath();
ctx.moveTo(outer.x, outer.y);
ctx.lineTo(outer.x, outer.y + outer.h);
ctx.lineTo(outer.x + offset, outer.y + outer.h + offset);
//ctx.lineTo(outer.x + offset, outer.y + outer.h);
ctx.lineTo(outer.x + outer.w, outer.y + outer.h);
ctx.lineTo(outer.x + outer.w, outer.y);
ctx.lineTo(outer.x + offset, outer.y - offset);
ctx.lineTo(outer.x, outer.y);
ctx.stroke();
//ctx.rect(outer.x, outer.y, outer.w, outer.h);
ctx.clip();
ctx.fillStyle = vm.borderColor;
// ctx.rect(inner.x, inner.y, inner.w, inner.h);
ctx.fill('evenodd');
ctx.restore();
},
產生這樣的結果:
更有可能從源導入 Chart.js,您將需要制作自己的圖表類型作為條形圖的擴展。
(function(Chart) {
var helpers = Chart.helpers;
Chart.defaults.triBar = {
hover: {
mode: "label"
},
dataset: {
categoryPercentage: 0.8,
barPercentage: 0.9
},
scales: {
xAxes: [{
type: "category",
// grid line settings
gridLines: {
offsetGridLines: true
}
}],
yAxes: [{
type: "linear"
}]
}
};
Chart.controllers.triangleBar = Chart.controllers.bar.extend({
//
// extend element_rectangle draw function here
//
});
}).call(this, Chart);
添加回答
舉報