我想在紅色圓圈中添加計數數字,我試圖使用plt.text,但我不知道如何在其中添加參數我的代碼:path = "bogus_student_data.txt"data = pd.read_csv(path, sep=' ')final_grade = data['grades']plt.hist(final_grade,bins=5, rwidth=0.8, histtype='bar', facecolor='blue',edgecolor='black')
1 回答
大話西游666
TA貢獻1817條經驗 獲得超14個贊
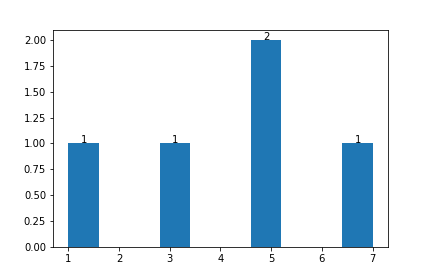
y = [1, 5, 3, 7, 5]
fig, ax = plt.subplots()
h = ax.hist(y)
for v, i in zip(*h[:2]):
if v > 0:
ax.text(i + 0.25, v, str(int(v)))
fig.show()
結果:
添加回答
舉報
0/150
提交
取消